|

 MyVoice home [NL]
<-- Back |
FT2232 JTAG for lpc2xxx
15 March 2007: Re-learning GDB ...
I have only been working with the RealView tools since the last 4 years. This means that I now have to re-learn how to handle GDB. This is not a big issue but it does mean that I need to check the manuals frequently to discover how to do something.
Since I seem to have some strange dependencies between the ft2232 and the target lpc2138 (mounted on the same board, both powered via USB and did I mention there is no reset switch on the board?) I decided to connect the JTAG board to the LPC2468 OEM board. Now I can reset and power my target independent from the target CPU.
I only connected the standard JTAG lines (TCK, TMS, TDI, TDO and TRST) but I did not connect the RTCK and the Target reset. The RTCK line is not being used and the target reset is connected to the lpc2138 on the JTAG board also - and since I have to keep that line low to get all I/O pins into Hi-Z it cannot be connected.
This confirms what I did two days ago: Everything works and I have no problems debugging. This is a great low-cost debugging solution and having a board with embedded JTAG gets students and hobbyists on the move very fast. It is not a real viable professional debugging solutions; the connections between the target and openOCD and between gdb and openOCD are sometimes lost and sometimes openOCD just bails out because of some error. From a professional user's standpoint I need a fool-proof debugger that copes with errors (either from the user or the hardware/software) but it is a simple solution to download new files into memory and is about 10 times faster than a 38400 bps RS232 connection.
For my projects at home this is a good debug solution. As a professional I use the RealView compiler suite with a RealView ICE but that is way to expensive at home, here I use gcc and gdb.
|
13 March 2007: Things start working
Running arm-elf-gdb
While tracing with the locig analyzer I found some strange signal behaviour. To see more I decided to remove both the RTCK and CPU_RST feedback lines (R22 and R24) and suddenly things start working. openOCD does not report any strange results on the JTAG interface and I can see proper responses from the target.
From arm-elf-gdb I can now load and disassemble the code:
(gdb) target remote localhost:3333
             Remote debugging using localhost:3333
             _startup () at startup.S:102
             102 startup.S: No such file or directory.
 in startup.S
 Current language: auto; currently asm
 (gdb) load
 Loading section .text, size 0xb90 lma 0x40000200
 Loading section .rodata, size 0x160 lma 0x40000d90
 Start address 0x40000200, load size 3312
 Transfer rate: 65261 bits/sec, 368 bytes/write.
 (gdb) disass main
 Dump of assembler code for function main:
 0x400003c4 <main+0>: str lr, [sp, #-4]!
 0x400003c8 <main+4>: bl 0x400009b4 <eaInit>
 0x400003cc <main+8>: mov r0, #75 ; 0x4b
 0x400003d0 <main+12>: bl 0x40000368 <delayMs>
 0x400003d4 <main+16>: ldr r0, [pc, #124] ; 0x40000458 <$d>
 0x400003d8 <main+20>: bl 0x40000568 <simplePrintf>
Single stepping and looking at registers also works:
(gdb) stepi
142     in startup.S
(gdb) stepi
143     in startup.S
(gdb) stepi
144     in startup.S
(gdb) stepi
147     in startup.S
(gdb) stepi
148     in startup.S
(gdb) info registers
r0             0xe01fc080       -534790016
r1             0xaa     170
r2             0x55     85
r3             0x0      0
r4             0xe002c000       -536690688
r5             0x7fffef1c       2147479324
r6             0x4000012c       1073742124
r7             0x0      0
r8             0x4c614e40       1281445440
r9             0x14880f15       344461077
r10            0xb4291e04       -1272373756
r11            0x6832a40        109259328
r12            0x1d401043       490737731
sp             0xc1392104       -1053220604
lr             0x40000550       1073743184
pc             0x4000024c       1073742412
fps            0x0      0
cpsr           0x400000d7       1073742039
(gdb)
Go!
This works ok, it steps through the first few lines of the boot code and the registers have the correct content.
I am still having problems placing breakpoints but this is defenitely working - I can even execute the continue command from gdb and I see the output on my terminal program (so I am connected to the real stuff and not to the simulator ;-)
|
11 March 2007: Another ft2232 JTAG debugger for the lpc2xxx
One more for the hive
It almost seems like every developer starts to develop his/her own JTAG debugger and sometimes I am wondering why ...
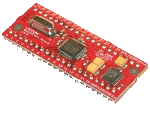
In my case, I got the ft2232 for free so this absolutely beats any commercial solution (from a price point of view) and I now have a very small matchbox-size development board with the ft2232 and an lpc2138.
openOCD
Well, I'd prefer a proper RDI solution to connect the the RVDS suite from ARM but this is an ARM proprietary protocol so I have to go for a gdb solution and then openOCD is the commonly used alternative.
The board is designed to match the USBJTAG-1 design which is provided in the thesis from Dominic Rath so it should work straight out of the box ...
Problems
For some reason things don't work and openOCD does not even start.
After some time I found that the problem may be in the fact that both target and JTAG are powered at the same time. Some race condition when power is applied and the solution looks simple: reset the target CPU after USB is initialized and openOCD starts but gdb is refusing to work with the board, I do not get any proper responses out of the board right now.
|
|
|
|
